Covid-19 and its overall effect on England and Wales death rate.

Covid-19 has affected death rates in obvious ways: it has been a direct cause of death; it has occurred alongside other illnesses, resulting in some earlier deaths as a consequence; its disruptive presence throughout the health service has resulted in early deaths for some who have been denied life-saving treatment, or have been reluctant to seek treatment, for other conditions. As 2020 comes to a close, we can see the overall effect of covid over getting on for a whole year and its overall impact on the death rate for England and Wales.

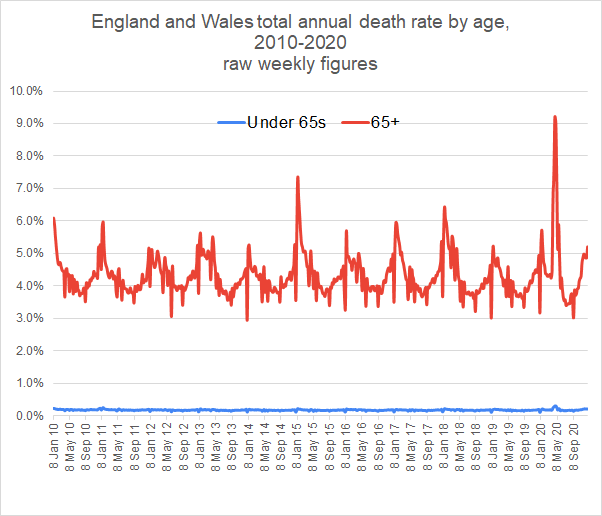
This graph shows the erratic nature of the weekly death figures. There are big spikes down at Christmas (and other holidays) when deaths are reported late and up just after New Year when the deaths over Christmas are added in. But this graph already shows some interesting figures.

The death rate for over 65s is about 4%. That means that 1 in 25 over-65s die within a year on average. But since there are about 11 million people over 65, that is about 440,000 over-65s deaths per year.

The death rate for under-65s is about 0.2%. We can see that that it has varied little as a result of covid. On average 1 in 500 under 65s die every year. And since there are nearly 50 million under-65s, that means that there are about 100,000 under-65s deaths per year.

The average total death rate for England and Wales is the 440,000 over-65s plus the 100,000 under-65s, giving a total annual death rate of about 540,000.

If we average the weekly death rate over a 4-week period, we see more of the underlying pattern.

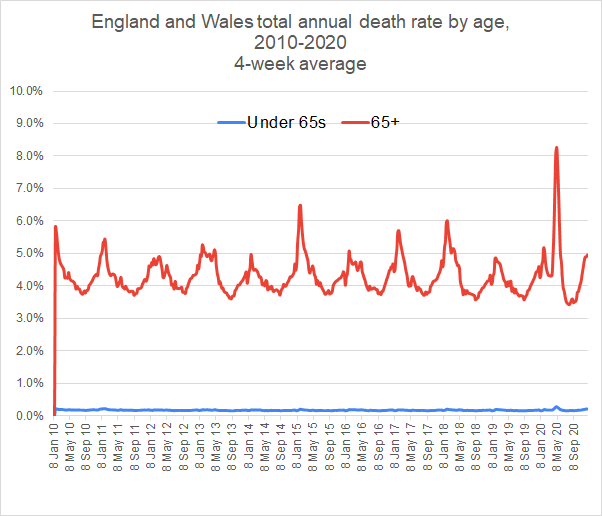
This shows that the death rate for over 65s varies quite a lot over the year, hitting a peak sometimes over 6% in the winter, dropping to below 4% in summer. This year we had a very high peak of over 8% in March but that was followed by particularly low death rate in August. Some of those who died in the April covid peak did not live to die at their expected time of August. This provokes the question as to what extent the reduced deaths of August compensated for the increased deaths in May. To find out the extent of this balance, we average over a longer period of 4 months.

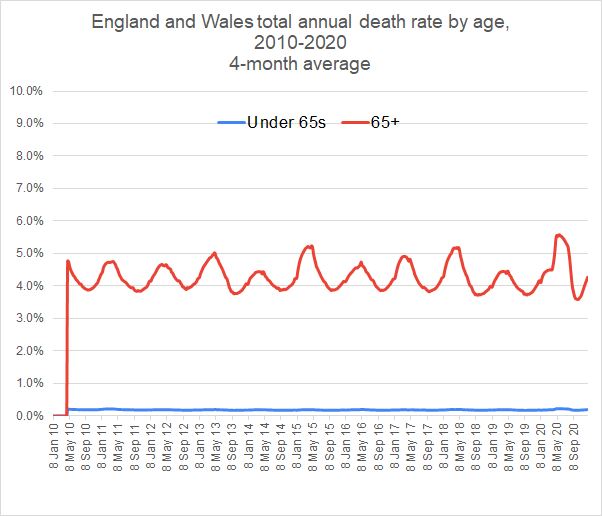
The 4-month average shows that 2020 is only a slightly unusual year. For the over-65s, the death rate rose to a high of 5.6%, while falling to an unusual low of 3.6% in September.

Certainly covid was instrumental in the particularly high death rate in April but there was another contributory factor: winter 2018-19 was a year in which there were relatively few flu deaths. This means that the vulnerable who would normally have died in that winter were still around in the peak of the 2019-20 season and among those who succumbed to covid.

We still see the particularly low death rate of 3.6% in September, a consequence of the vulnerable dying in April and not being around to contribute to the September statistics.

Monthly figures are not available for years before 2010. But whole year figures are available from 2006 and are shown here.

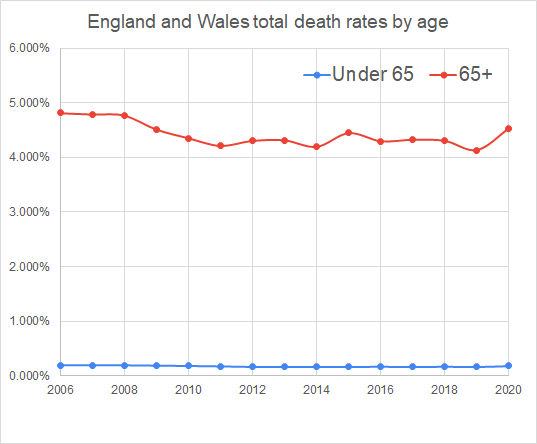
As can be seen, the 2020 death rate is entirely normal in the historical context, having an overall death rate for over 65s of 4.5%, slightly more than the peak of 4.4% in 2015 but less than the 4.8% figures from 2006 to 2008

Calculating total excess deaths
On the basis of previous years we predict how many deaths we would expect in a given year and compare it with the actual number of deaths. These figures we have been dealing with enable us to make a prediction for death rates for 2020.

If we confine our calculations to the recent low death-rate years, the average death rates for under-65s from 2013 week 52 to 2019 week 51 are as follows:
Under-65s – 0.169%
Over-65s – 4.321%

Using the figures below for the numbers in the two cohorts, this gives predicted deaths for 2020 of
Under-65s – 83,376
Over-65s – 459,545
Total – 562,922 (The extra 1 being a consequence of rounding issues.)

In fact the total deaths in England and Wales for 52 weeks from 2019 week 52 to 2020 week 51 has been 600,058. This is an excess death figure of 37,136. However, if we compare 2020 with 2006-8, we find that 2020 has had 27,491 fewer deaths pro rata than these years.

Even if the excess mortality in 2020 is close to 37,000, that includes deaths from all causes, including the knock-on excess deaths from all other diseases where treatment has been disrupted by attention to covid. (Many of us know perhaps more individuals who have had life-saving treatment disrupted than individuals who have died of covid.)

Bearing in mind that there have been suggestions that excess deaths for cancer may be, at a minimum, in the order of 10,000, it seems likely that the excess deaths due to covid will be well under 30,000. This is in stark contrast to the figure published for covid deaths in England and Wales of 65,795 (as on 31/12/2020).

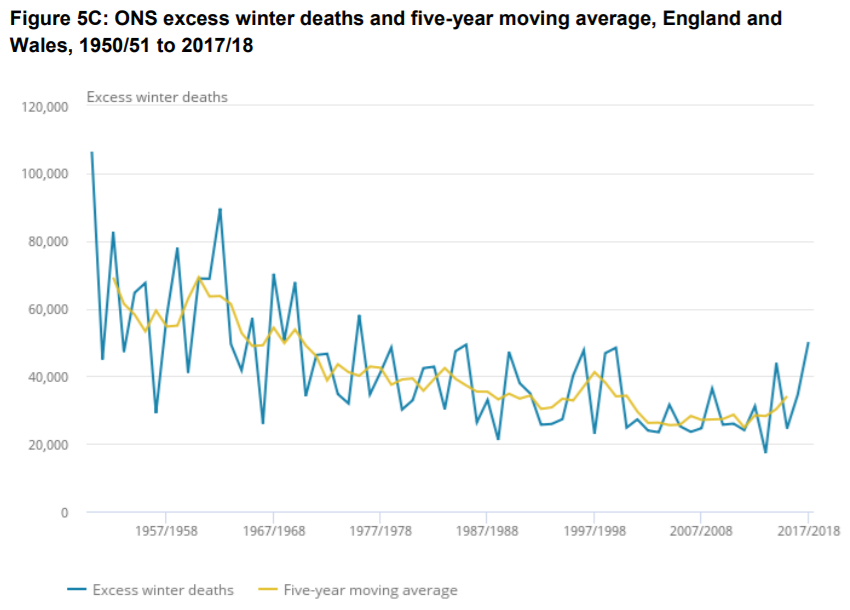
As can be seen from the graph below about excess winter deaths, seasonal deaths commonly vary by over 20,000 from one year to another. In which case, even were the 37,000 excess deaths this year all due to covid, that would not be far out from the range of swings that habitually occur from year to year – see the graph below.

Survivability – the chance of surviving the year
So far we have calculated in terms of death rates, the chance of dying in a year. But a different, and possibly more relevant, perspective is to consider the chance of surviving the year, a more useful way of seeing the impact of covid on our lives.

For those of us over 65, over the 6 years from 2013 to 2019, the death rate was 4.3%, meaning that our chance of survival was 95.7%. 2019 was a particularly good year in which survivability of over-65s was 95.9%. In 2020, with a death rate of 4.5%, survival rate has been 95.5%.

Here we can see how survivability has changed over the last fifteen years.

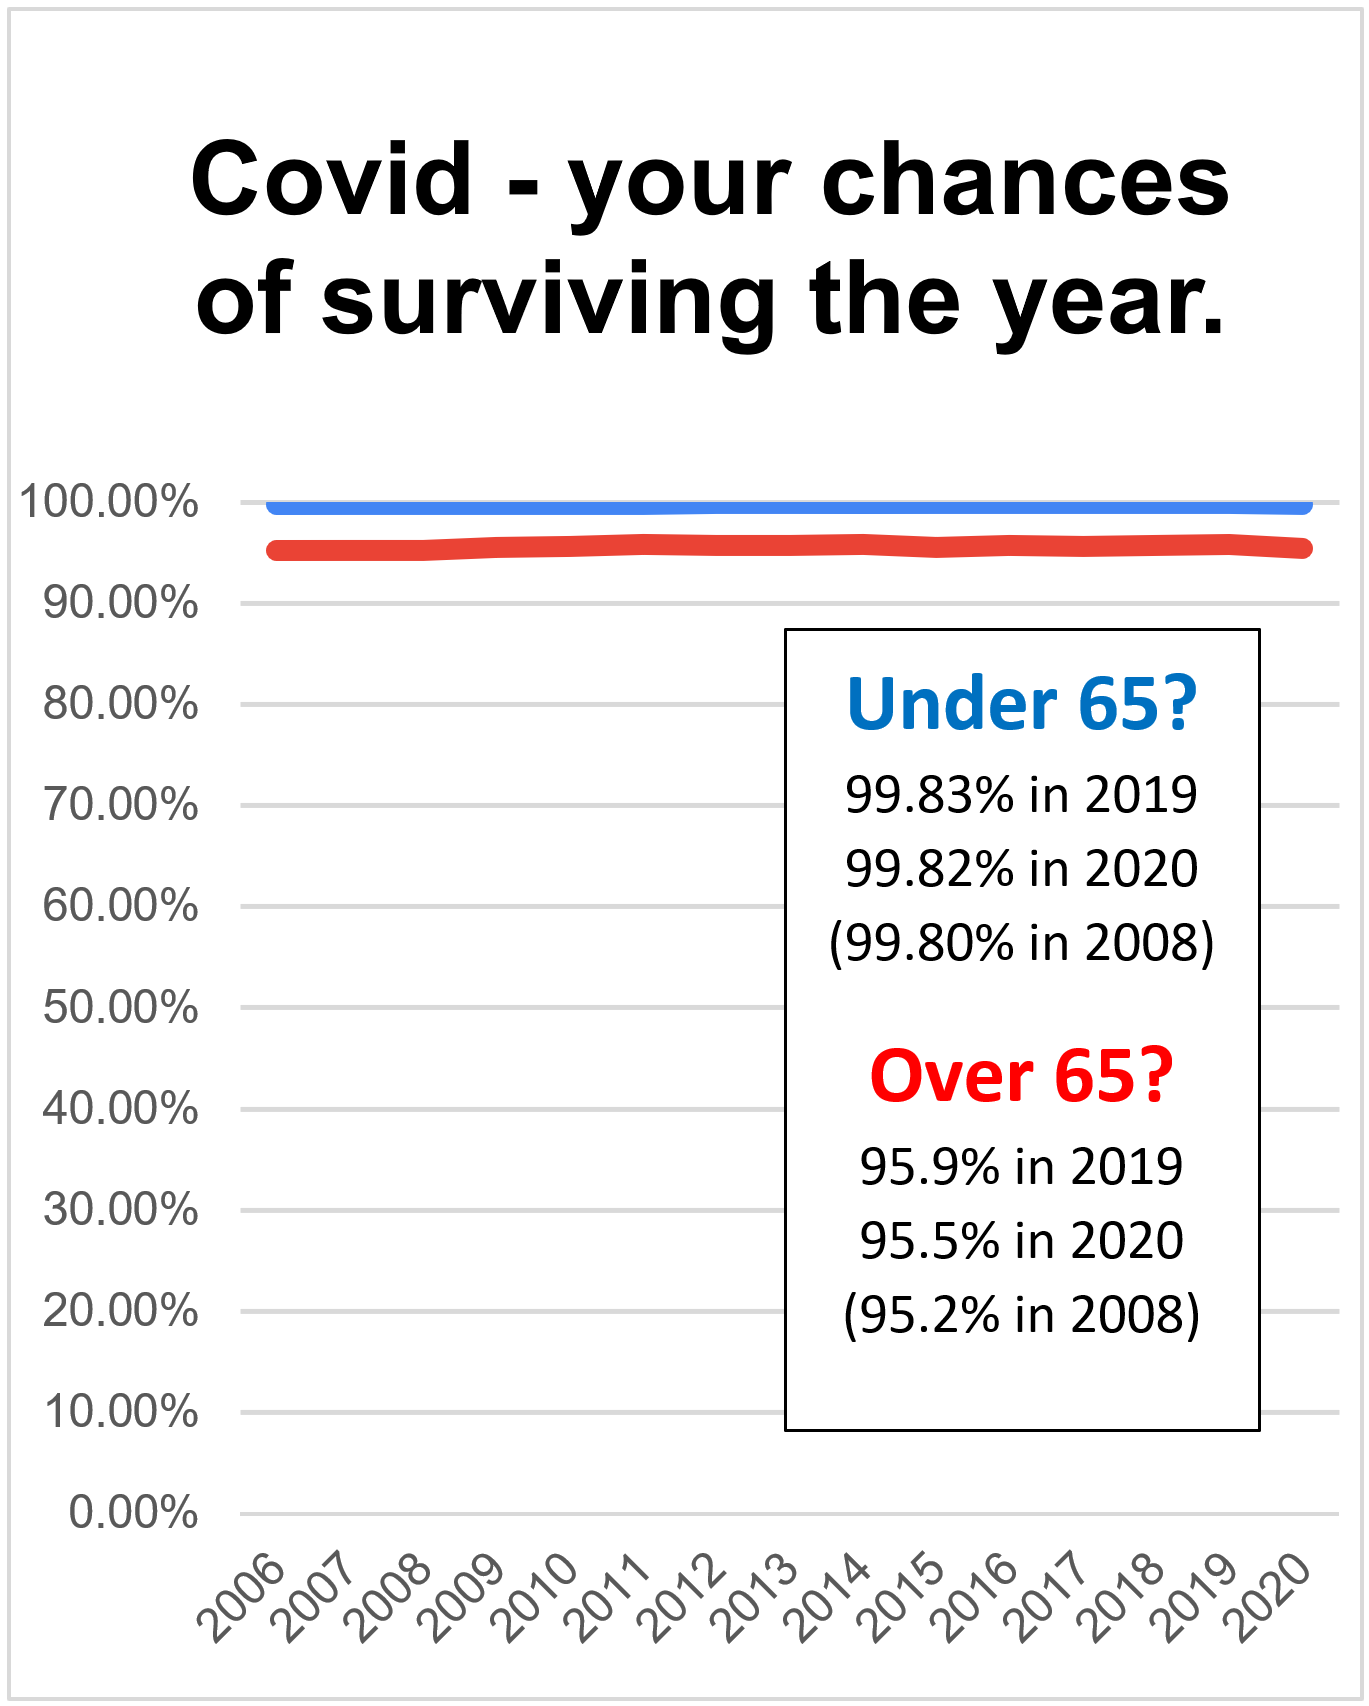
With over-65s survival rate consistently a little above 95% we can see that the effect of covid has been really very small. We can stop worrying and regard 2020 as a normal year.

Since first publishing this, the Office for National Statistics has crunched the figures. Their figures are for the 12 months to the end of November 2020. Here is the graph for age-standardised-mortality.

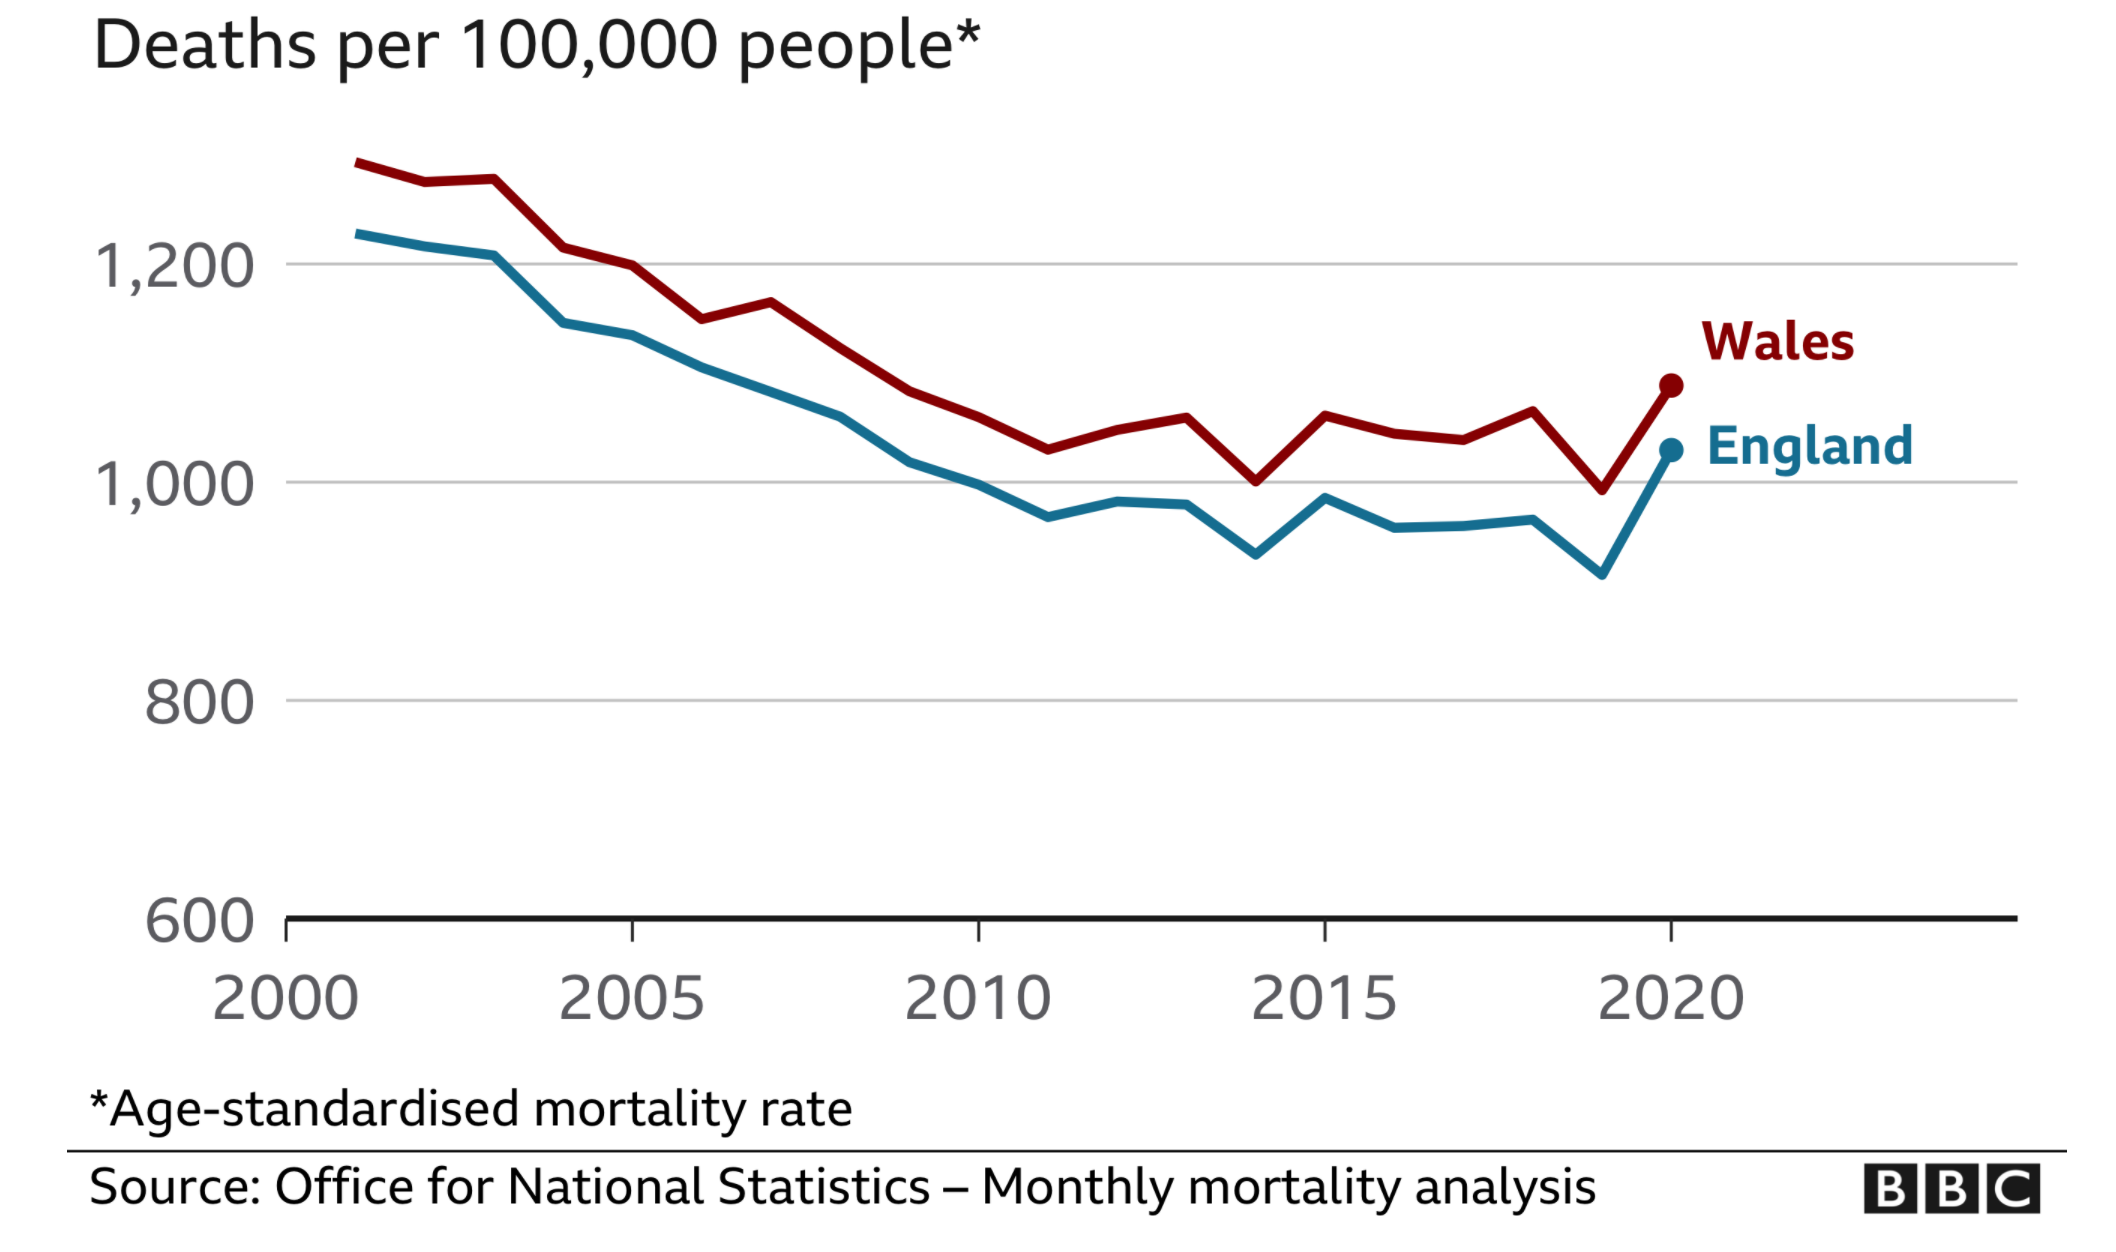
As you can see, this graph is pretty much identical in shape to my own graph on death rates above. Again it shows that 2020 is not a particularly exceptional year.

The BBC, in their publication of the ONS statistics, were very naughty. They focused on the excess deaths in 2020 being greater than any other year since the Second World War. Well, since the population (at 68 million compared with 47 million during WW2) and the proportion of over-65s (18% as opposed to 10%) are greater in 2020 in any other year, of course we should expect the death rates to be greater.

Statistical notes
These figures are produced by taking the ONS published weekly death rate figures, multiplying them by 52 to give an annual death rate figure and dividing them by the numbers in the two cohorts (0-64 and 65+).

Numbers in the two cohorts are calculated from published UK population figures, reduced by 11.3% decreasing to 11.0% from 2010 to 2020 to account for those in Scotland and Northern Ireland.

Percentage of over-65s in the UK population is derived from the sources below, interpolating between fixed point data where necessary. Here are the figures used.

https://www.ons.gov.uk/peoplepopulationandcommunity/birthsdeathsandmarriages/deaths/datasets/weeklyprovisionalfiguresondeathsregisteredinenglandandwales

https://www.ons.gov.uk/peoplepopulationandcommunity/birthsdeathsandmarriages/deaths/datasets/weeklyprovisionalfiguresondeathsregisteredinenglandandwales

https://www.ons.gov.uk/peoplepopulationandcommunity/birthsdeathsandmarriages/ageing/articles/whatdoesthe2011censustellusaboutolderpeople/2013-09-06#:~:text=In%202011%2C%209.2%20million%20residents,from%202001%20with%208.3%20million.

https://assets.publishing.service.gov.uk/government/uploads/system/uploads/attachment_data/file/827518/Recent_trends_in_mortality_in_England.pdf

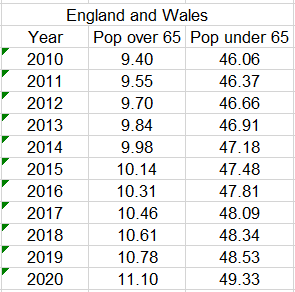
https://www.thelancet.com/journals/lanonc/article/PIIS1470-2045(20)30388-0/fulltext

https://www.univadis.co.uk/viewarticle/uk-covid-19-daily-up-to-35-000-excess-cancer-deaths-predicted-724669

https://www.ons.gov.uk/peoplepopulationandcommunity/birthsdeathsandmarriages/deaths/datasets/deathsregisteredinenglandandwalesseriesdrreferencetables

Multiple bank accounts

For a long time I was a believer in a single, well-checked bank account. I realised now that I’d never checked most of my spending. I had a rough idea how much it was because I noticed whenever I took out £100 or so from the bank and how long it had been since I last withdrew cash. At any instant I could see how much cash I’d spent by how much was left in my wallet. But I never checked small amounts like the 49p for cable clips, or the £1.50 for a pasty, because I never checked individual receipts for cash payments.

I always had a rough idea how much cash I spent which I checked by matching 4 or 5 cash withdrawal slips with the bank statement, at the same time checking the dozen or so big items which were not cash, and my total cash spending from the cash withdrawal

Then the world changed as the number of card payments from my ‘single, well-checked bank account’ steadily rose. Come bank statement checking time, I found it was a nightmare with so many bits of paper. The big items were being disguised by a large number of small items, like 49p for some cable clips or £1.50 for a pasty. Bank account checking, which had been easy, became difficult. That coincided with a suggestion from a family member that multiple bank accounts were worth considering and eventually I was converted. I now have four main bank accounts:

Income
Bills
Savings
Day-to-day

Income account
All my income goes into my Income account. From that account there are three standing orders to my other three accounts. It takes seconds to check my Income account statement because just my income goes in and three standing orders come out.

Bills account
I have a Bills spreadsheet (Google docs) which lists all my regular bills, including estimated amounts for things that I know will happen. It’s something like this:

The spreadsheet tells me that my regular bills are something around £650 a month and there is a standing order from my Income account to my Bills account of £700 a month. It’s easy to check my Bills account because there is the single income from my Income account and a number of payments, all of which I am expecting and included on the spreadsheet. As the years go on, I add more and more things to the Bills spreadsheet which gradually gets clearer as a predictor of the regular outgoings.

Savings account
There is a standing order from my Income account straight into my Savings account, of an amount I have decided to save every month. (In fact there is another standing order into the Savings account of £150, the car replacement cost and the family holiday cost. Those amounts, too, accumulate in my savings account and, come new car time and holiday time, those bills are paid from my savings account.) Checking my savings account is easy. There are the two standing orders, one from Income and one from Bills, and that’s it until I spend on holiday or car.

Day-to-day
The third payment from my Income account is to the Day-to-day account. From that I pay food, car fuel, meals out, any hobby expenditure, paint for the house, furniture, books, magazines, Amazon expenditure, Ebay, optician charges…plus cable clips and pasties. In other words, all the other expenditure. My credit card comes out of this account as well. So all my expenditure is summarised by the Bills account or the Day-to-day account, through which all my expenditure is paid.
My day-to-day account is a Starling account, though Monzo is just as good. Starling is an electronic banking account that is very easy to use and check. It is my wallet and gets filled up by the standing order at the beginning of the month. At any stage of the month I can look at it and see how much I have spent and how much I have left.
Do I check the Day-to-day account? No I don’t. It’s like I used to treat my wallet. I only look at the totals. But it’s better than my wallet because I can look back at the expenditure over the month and instantly see the patterns in my expenditure. Starling provides me with monthly summaries categorising my expenditure as well as the detail if I want it.

The consequence of all the above is that I check Income, Bills and Saving monthly. But it only takes seconds, because they are so easy to check. I check Day-to-day quite often but briefly, seeing how long it is until the end of the month and how much I have left. As for the nightmare of monthly checking of my bank statements, that has gone completely. Life is so much easier and clearer.
Is this OCD? Possibly. But actually it is appropriate OCD. Appropriate OCD makes life easier, reducing the time doing things that one doesn’t want to do, leaving more time for the things that one does want to do.

Other accounts
For a while, bank accounts have been free. So, if a different type of expenditure arises, it’s been easy to have another account for that expenditure. Even where there is a charge (Starling charges £2 a month for extra accounts) it can be worth having additional accounts if you can’t get a free one from a different bank. House renovations: get a house renovation account. Pay for everything with a card from that account and instantly you can see how much has been spent on the whole project. If it’s easier, and to avoid confusion, it’s possible to have separate car and holiday accounts to keep them separate from general savings. Husband and wife ‘pocket money’, separate from general household expenditure, can also go in separate accounts.
Other forms of income – share dividends, self-employed work etc – can also each have their own account. That way, come tax return time, all the information is in one account.

Power tools – battery vs mains

Here is a very rough comparison of the costs of mains and 18V power tools. The comparisons are between Einhell, Makita, deWalt, Milwaukee and Bosch. The comparisons are rough and ready, using the cheapest available items in each category in Screwfix, Toolstation and Wickes online as sources for the prices. There was no attempt to match specifications, for instance by ensuring that all were brushless, etc. Milwaukee corded tools are not included because they do not seem to be generally.

Don’t compare directly the Total, excluding battery, column for corded and cordless, because the former does not have an impact driver included.
The brands are in price order with Einhell by far the cheapest and Bosch most expensive.

Thoughts:
1. There is not an awful lot of difference between the main brands, particularly since I noticed that the Bosch cordless tools are particularly highly specified, which accounts for some of the price premium over the others. A friend whose judgement I trust says that the Milwaukee quality is better than Makita.
2. The cordless premium is calculated by subtracting the corded prices in the corded column from those in the cordless. As can be seen, the cordless premium is relatively low (around 10% when one takes into account the previously mentioned high specifications of Bosch cordless). So, once one has the batteries and charger, one might as well go cordless.
3. All brands have one or two cheap offers which bundle a couple of batteries and a charger, making the transition to cordless less than the prices above indicate.
4. Makita LXT was launched in 2005 and is still their major brand. So the technology is mature and obsolescence of currently purchased tools unlikely to be a problem.
5. Makita is a market leader and it may be that its ubiquity stimulates competition which tends to drive the price down.

Relevant reviews

https://www.pyracantha.co.uk/top-6-best-impact-driver-reviews/

On Trustpilot, Einhell seems to get poor reviews, whereas Einhell UK gets good ones. Bizarre. Toolstation has variable reviews of Einhell. Wickes has generally good reviews of the brand.
https://uk.trustpilot.com/review/einhell.co.uk
https://uk.trustpilot.com/review/www.einhell.com

Makita seems to have chuck problems. See for instance:
https://www.screwfix.com/p/makita-m8101k-710w-electric-percussion-drill-240v/3043r

Other random thoughts
Mainstream manufacturers are also producing 10.8 V or 12 V tools in addition to 18 V. I suppose that ‘small and light’ must be the aim. At the same time there is a tendency to move to higher voltages for beefier tools, sometimes double 18 V and sometimes treble. So the battery market seems to be getting more diverse rather than more standardised.