Any analysis of the mortality of covid depends on comparing the death rate with that of other years. A direct comparison is unfair because the population of 2020-2021 is larger than in earlier years and has a greater proportion of older people. This post produces age distribution date for the years 2010-2021, stating the sources and explaining the method by which the age distributions are calculated.
2011 census figures
2011 census has detailed figures of the Usual resident population by five-year age group for the whole of the UK and England and Wales figures alone.
These figures show that, in each age group, the population of Scotland and Northern Ireland are an average of 11.24% of the population of the whole of the UK, a figure comparable with that used in previous calculations of the England and Wales population compared with that of the UK as a whole.
2018 estimated population figures
2018 figures are projections calculated by ONS. These projections give projected numbers in 1-year wide age ranges, from which the five-year age groups can be calculated.
Filling in the over-80 figures
The 2011 census lumps together all the over-80 figures. For the purposes of more detailed analysis, five-year age groups for over-80s have been constructed, distributing the 2011 figures for over-80s amongst the five-year age groups, assuming that the (reduced) number of over-80’s is distributed over the upper years in 2011 in the same way that the (larger) number of over-80’s in 2018 is distributed.
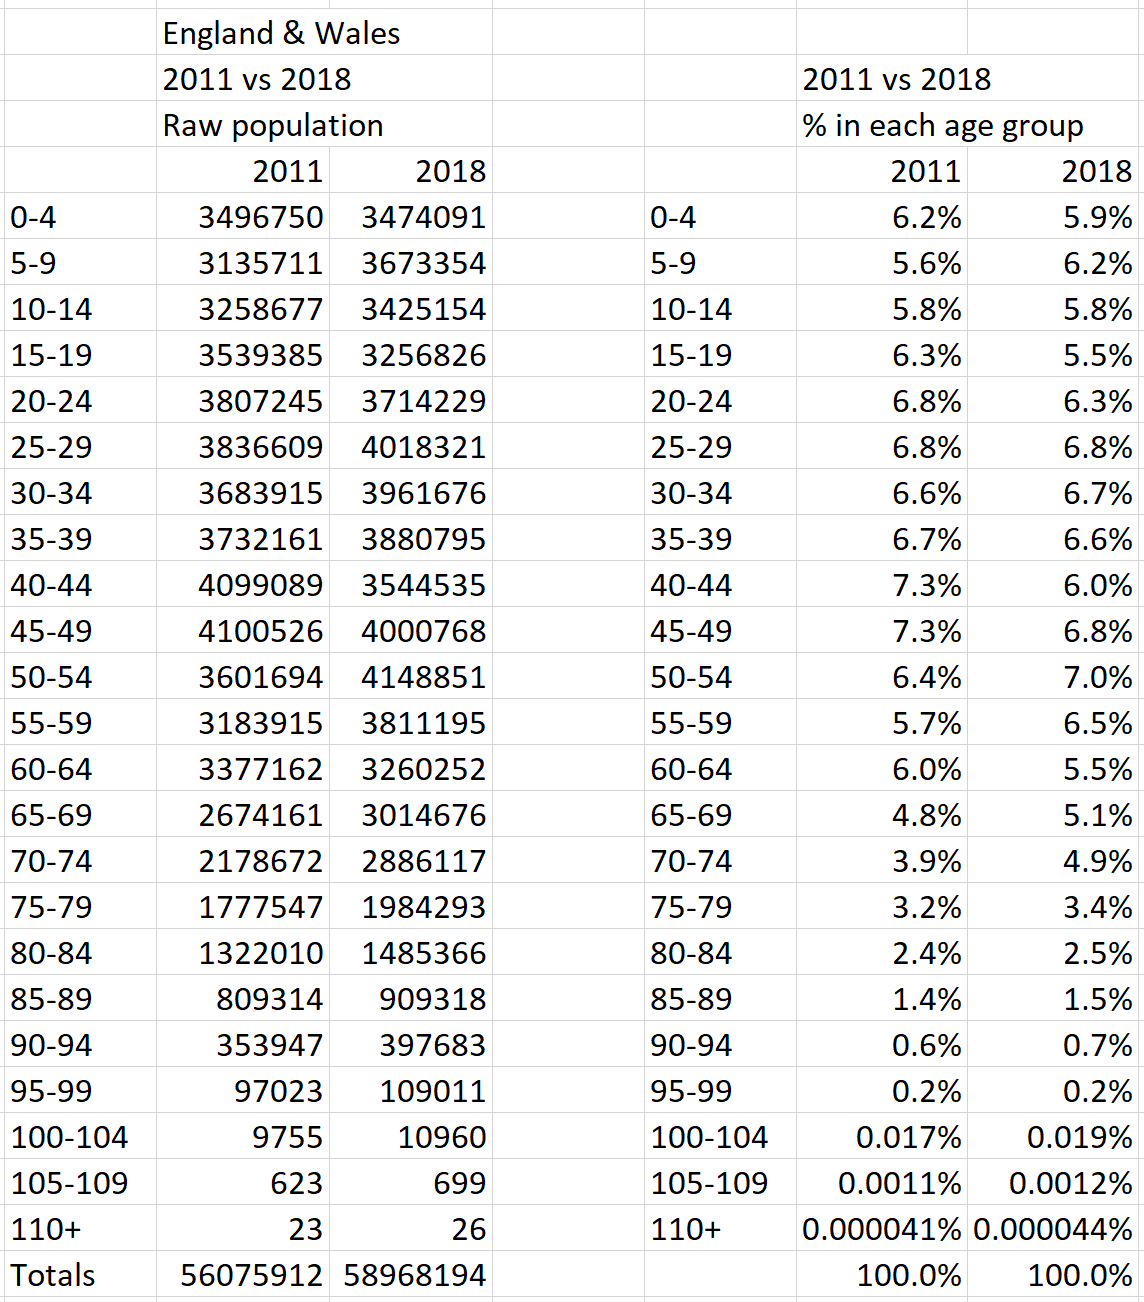
The above sources and calculations give us these figures:
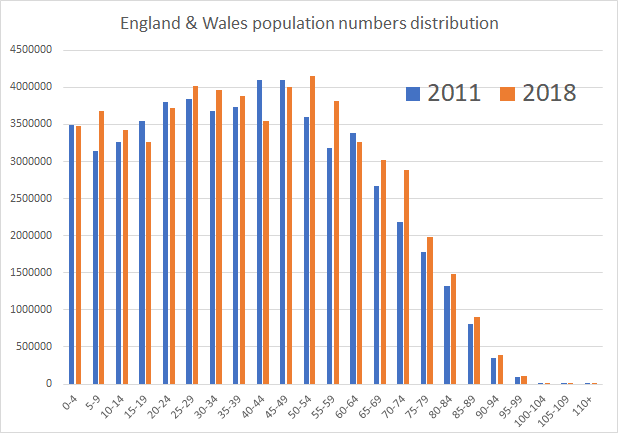
From this we get the following population distributions for 2011 and 2018.
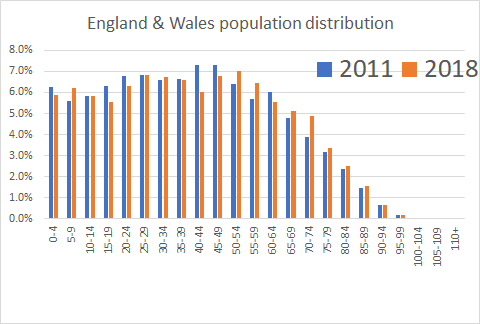
Note how the columns for 2018 are distinctly taller than 2011 in the age group above 50 as the bulges in the 40-49 group have aged between those two years and moved from their fifties to their sixties.
If we compare the population numbers in each age group between the two years 2011 and 2018, we see that the numbers over 65 are very significantly higher in 2018 because the effect already seen (an aging population) combines with an increasing population. Both of these effects lead to higher expected death rates.